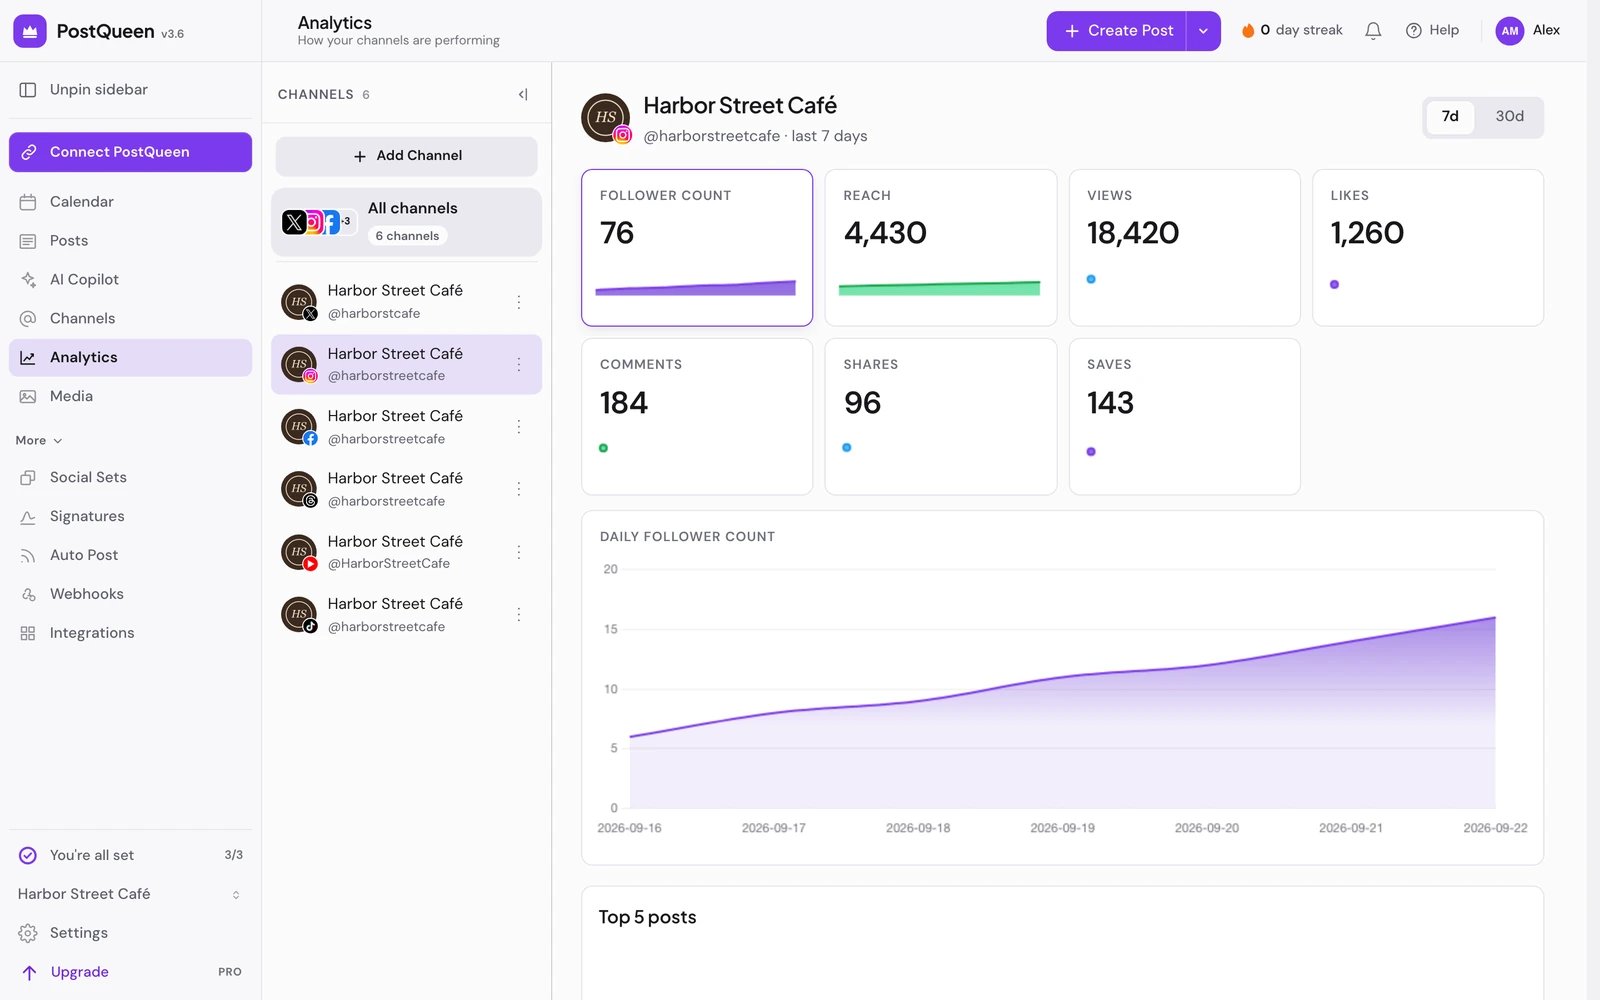
PostQueen analytics: engagement chart, followers, impressions and video views
Analytics in the left menu opens on the first channel in the list. Every metric that platform will part with gets a card: a small chart of the window, and one big number underneath.
She posts to more than 30 networks. Ten of them send numbers back. Measuring is the narrow part of PostQueen, and the line is drawn by the platforms, not by her.

Ten channels report back

Every other connector posts perfectly well and reports nothing. Reddit, Discord and Mastodon publish on time and stay silent afterwards, so a blank analytics view there is the platform being quiet rather than your install being broken. Those channels do not appear in the Analytics sidebar at all.
Only LinkedIn Pages report back. A personal LinkedIn profile posts and reports nothing.
It answers at the location level, which is why the per-post column above says no.
Set DISABLE_X_ANALYTICS and she stops asking X for numbers entirely. The X channel drops out of the Analytics sidebar and the Statistics icon disappears from X posts on the calendar. Useful when your X plan does not include analytics access. See X (Twitter).

What each channel returns

The card labels come straight from what each platform is willing to say.
The first four describe the account as it stands today. The four that follow, starting at Views, are added up across your twenty most recent videos, so they move as you publish rather than tracking the window you picked.
Those labels arrive in capitals because they are built from the raw metric names X returns, and she prints them as they come.

Reading a card

Each card carries the metric name, a chart of the window, and one large total.
Two YouTube metrics are averaged across the days instead of summed: Average View Duration and Average View Percentage.

The refresh control

A channel that shows nothing but a clock and the line This channel needs to be refreshed to display analytics is not broken. Its connection to the platform has gone stale.
1

She tries to renew it for you

When a stored token has expired she quietly renews it before asking for numbers, and only falls back to the visible refresh when renewal is impossible.
2

The channel asks for attention

In the sidebar it wears a red exclamation mark, and clicking that warns you to refresh the integration from the calendar first.
3

Press Refresh Channel

The Refresh Channel button underneath sends you back through that platform’s own login.
You land back in PostQueen with the numbers flowing again.
If the renewal fails outright, she disconnects the channel rather than leaving it half alive. Reconnect it from the calendar and the history comes back with it.

How fresh the figures are

Flicking between 7 and 30 days is instant, and a figure you are reading may be up to an hour old.

Per-post statistics

Hover a post on the calendar and a small chart icon appears, labelled Post Statistics. Click it and a Statistics window opens on that one post.
That icon only shows up on posts that have already published, so a scheduled post or a draft has no window to open in the first place.
The window picker offers 7, 30 and 90 days, and only LinkedIn Page turns that window into a day-by-day series. Every other network answers with the post’s numbers as they stand right now, so the picker changes nothing on those cards.
Post numbers are read live on every open, never cached, so what you see is what the platform said a second ago.
Pinterest answers for the last 90 days only, on the channel page and on the post, because that is as far back as Pinterest will look.

When a post cannot find itself

Sometimes a platform accepts a post and then declines to say which post it became. The Statistics window notices, and instead of an empty chart it shows you a grid of your recent content from that platform with a simple instruction: Select the content that matches this post.
Pick the right one, press Connect Post, and the statistics open immediately afterwards.
Underneath the metric cards sits a Short Links Statistics table with three columns. This section fills in only when a link shortener is configured on your install. She picks the first one whose key is present, in this order:
With none of them set, the table reads No short link results and nothing is being tracked.
Counted links are the ones on your shortener’s own domain, found in the post text, including the follow-up posts in a thread. A raw link you typed by hand and left alone is not counted, because there is nothing in the middle to count it.

The same numbers, elsewhere

Everything on these screens is the same payload the CLI and the API return, so a weekly client report does not have to start with a screenshot. The post endpoint has its own page, analytics for one post.

Next steps

Auto Actions

Turn a number into an action she takes for you

Analytics over the API

The same figures, in JSON

From the terminal

analytics:platform and analytics:post

Your channels

Which ten report numbers back